Agile Architecture Kanban
Tags [ kanban, queuing theory, WIP ]
We’ve recently spun up a new software architecture group at work, and at least some of what the architects are expected to do is provide “consulting” services: providing feedback on technical designs and approaches, doing technical research, providing technical opinions to product managers, etc. Since many of these are similarly sized, and “cycle time” for getting a response to our clients is an important metric, we opted to manage this work using a kanban system.
After a month-long iteration, we stopped to take a look at some of the data we had collected. We were able to produce a statistical process control chart, indicating our cycle time in business days (measuring the time between when a customer asked for something to be added to our consulting backlog and the time when we finished it), something like this one:
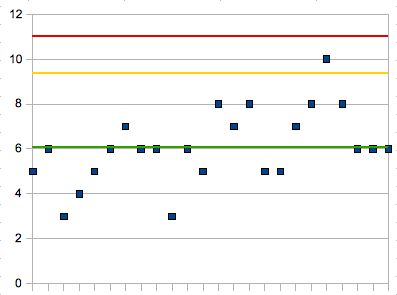
This shows our average cycle time was around 6 days, and that our process was under statistical control; all samples were less than the upper control limit (red line) at 11 days (3 standard deviations above the average). This means that we had a relatively predictable process. Now, at the same time, we were able to produce a cumulative flow diagram, like this one:

which showed the number of consulting “stories” in each state of the workflow. One of the things we were able to derive is the average arrival rate for the stories, by finding the slope of the line between the starting and ending points on the “ready” line. We were also able to find our average throughput by finding the similar slope between the starting and ending points of the “done” line. What we found (and which you can see on the graph), was that the request rate was higher than our throughput (by about 0.2 stories per day), which resulted in a slowly but persistently growing backlog. Now, we happened to measure our average cycle time about halfway through the month, and found that it was 4.5 instead of 6 back then. In the ten business days between measurements, our average cycle time went up by around the amount our backlog length grew, as predicted by the difference between our customers’ request rate and our service rate.
It would appear even architects are subject to queuing theory.
Going forward, in order to remain responsive to our clients (many of our engineering teams run two week sprints, so we wanted to shoot for an average cycle time of 3 days), we realized we were going to have to limit the size of our backlog. In other words, we were going to have to essentially issue a 503 (Temporarily Unavailable) response to some of our clients and simply not take their request onto our backlog and ask them to come back later, so as to remain responsive to our other customers. Just like we’d do in a web application server that was overloaded. Perhaps we’ll even develop a cute picture of a flying acquatic mammal to try to soften the “not yets” we’ll have to start handing out.